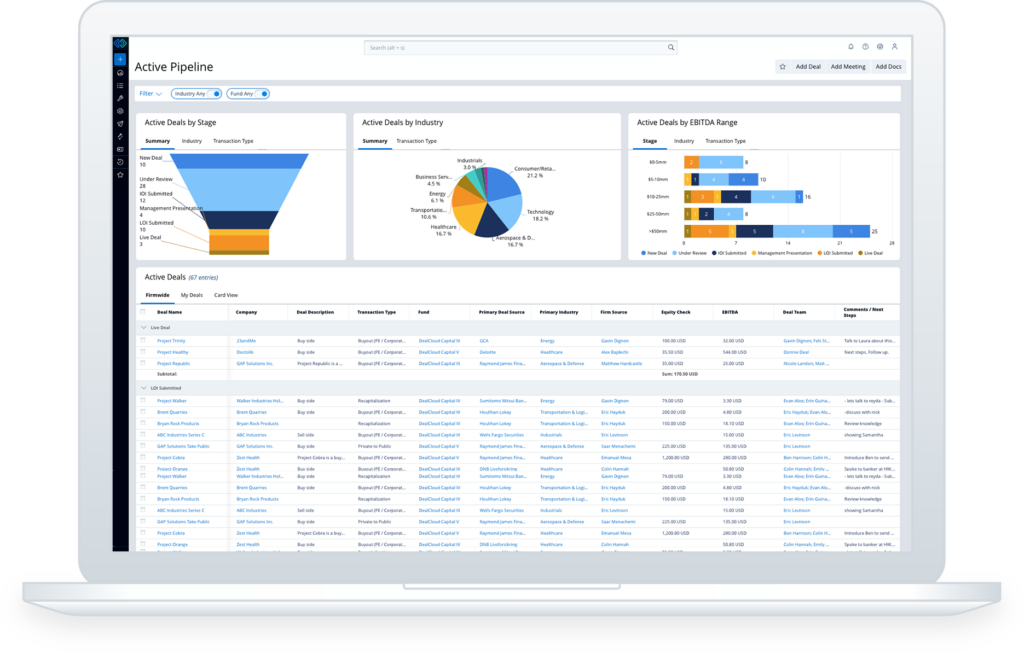
Get fully interactive reporting on your most important metrics — accessible anywhere from any device.
Create visualized reports, dashboards, charts, graphs, and tear sheets and customize them based on user roles. And with scheduled reporting, get reports with your latest data updated and sent out to stakeholders or investors — all automatically.


